North Attleborough Master Plan
North Attleborough Master Plan Data Page
This page presents information gathered and analyzed by SRPEDD in support of the ongoing North Attleborough Master Plan. Data helps answer many of the basic “where are we now?” and “how are we trending?” questions that can come up during a Master Plan process. As you will see, it is possible to interact with much of the data below by using your mouse to hover over, click on, or download select datasets. A "Data Poster (PDF)" offers an alternative view of these data as well. Data sources include the U.S. Census Bureau, the U.S. Department of Housing and Urban Development (HUD), the Massachusetts Department of Housing and Economic Development (DHCD), the Massachusetts Executive Office of Labor and Workforce Development (EOLWD), the Massachusetts Department of Revenue (DOR), North Attleborough Public Schools, the Town of North Attleborough, and SRPEDD.
Please note that this page is continually under construction as we incorporate new datasets. Please contact Eric Arbeene, AICP with any questions or comments - or if you have additional data that could inform the Master Planning process!
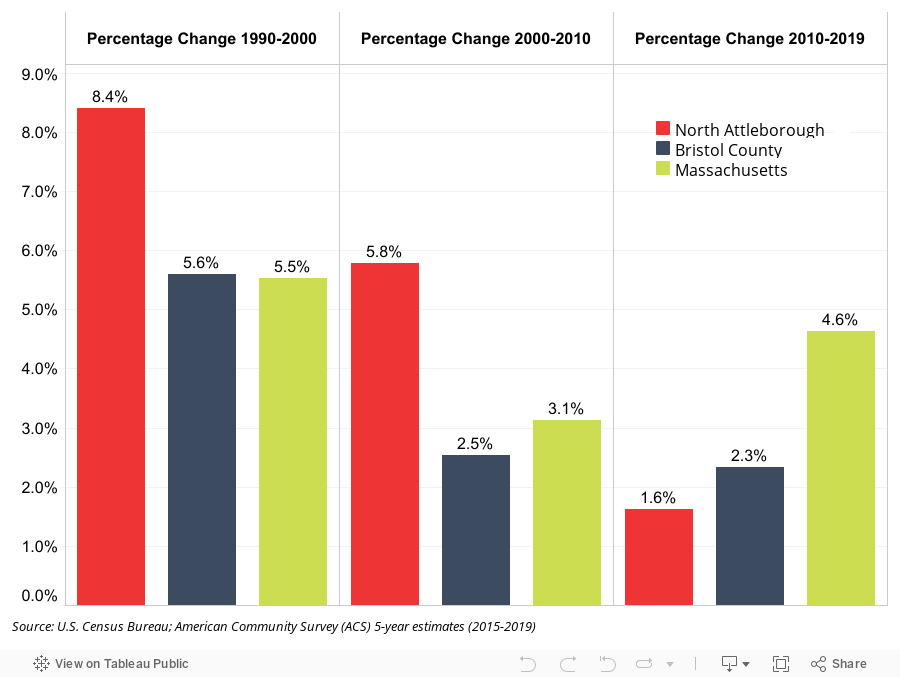
Population
North Attleborough’s population grew at a higher rate than Bristol County and the state through the 1990’s and early 2000’s, but the rate of growth has slowed considerably in recent years.
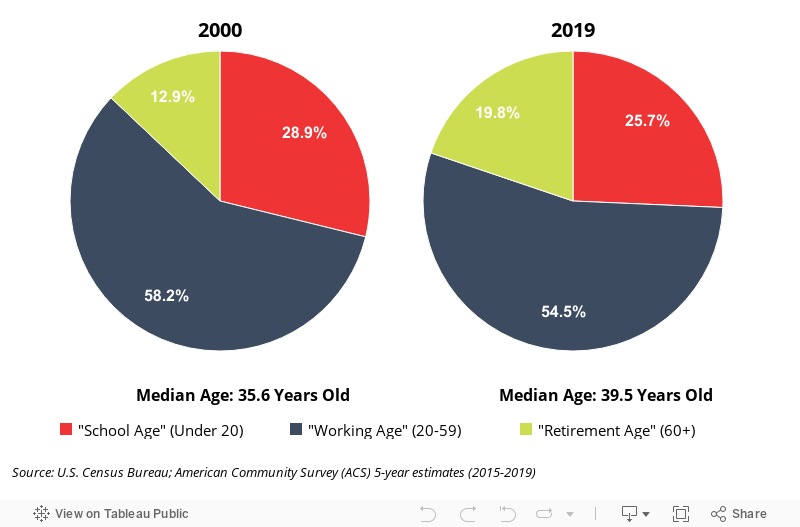
Age Trends
North Attleborough’s median age increased 3.9 years from 2000 to 2019. The “Retirement Age” population increased by 6.9%, while the “School Age” population decreased by 3.2%.
Households
North Attleborough’s total households increased between 2010 and 2019 by 1.2%. Household sizes have increased slightly over time.

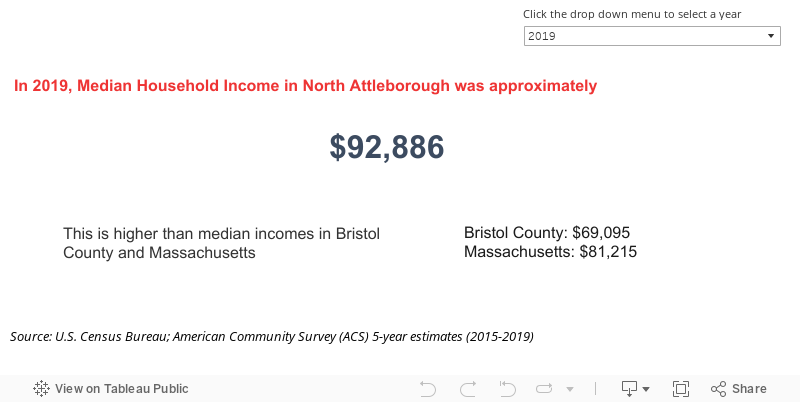
Income
In 2019, Median Household Income in North Attleborough was estimated at $92,886. North Attleborough is relatively affluent as compared to the Commonwealth and Bristol County.
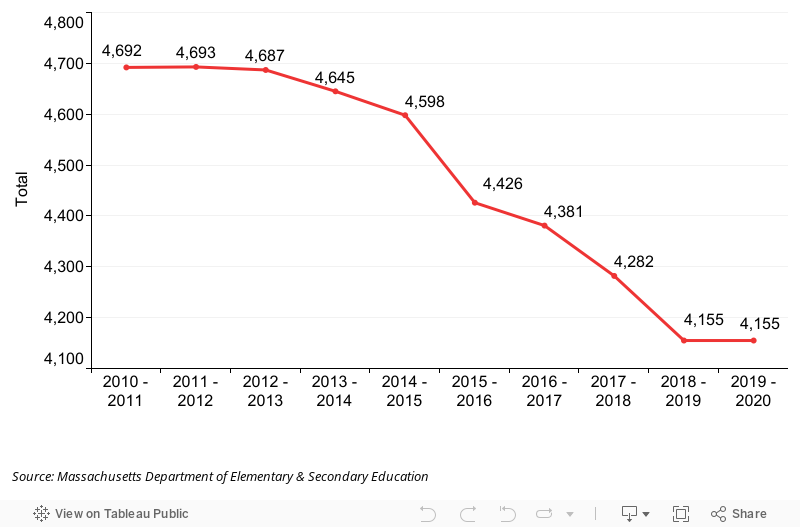
School Enrollment
North Attleborough’s school population has declined 11.4% in the last 10 years.
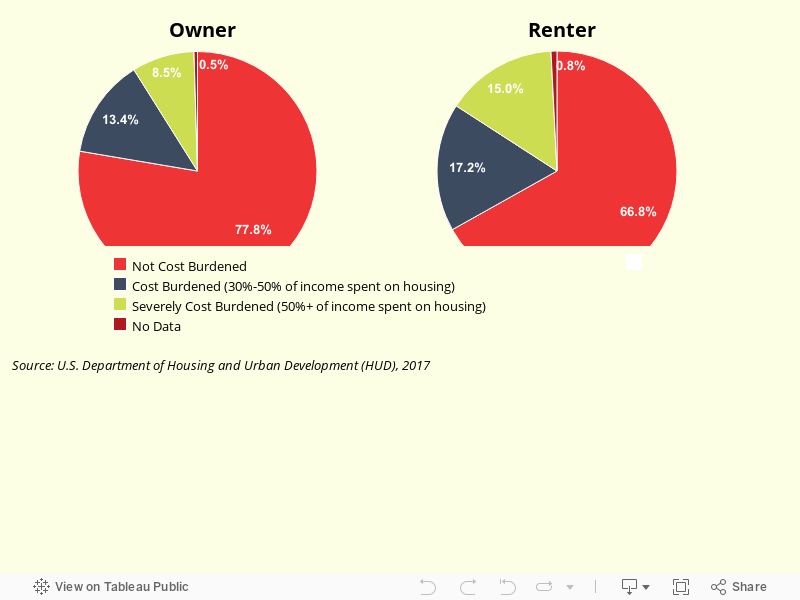
Housing
A household is considered “cost burdened” if it spends more than 30% of its income on housing costs. In North Attleborough, just under one quarter of homeowners and one-third of renters are considered “cost burdened”.
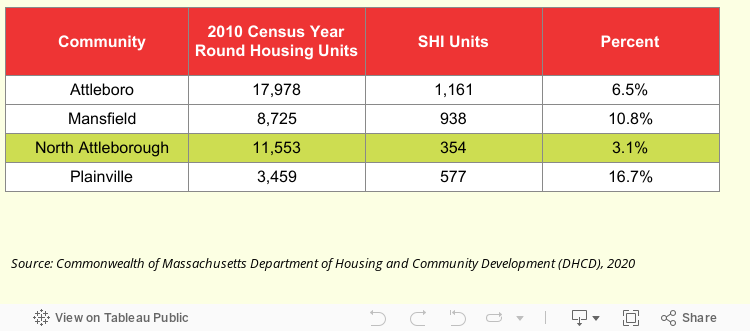
SHI
In order to gain control over the Chapter 40B process, North Attleborough must have 10% of its housing stock on the state Subsidized Housing Inventory (SHI) or meet annual production goals; it currently has only 3.1%.
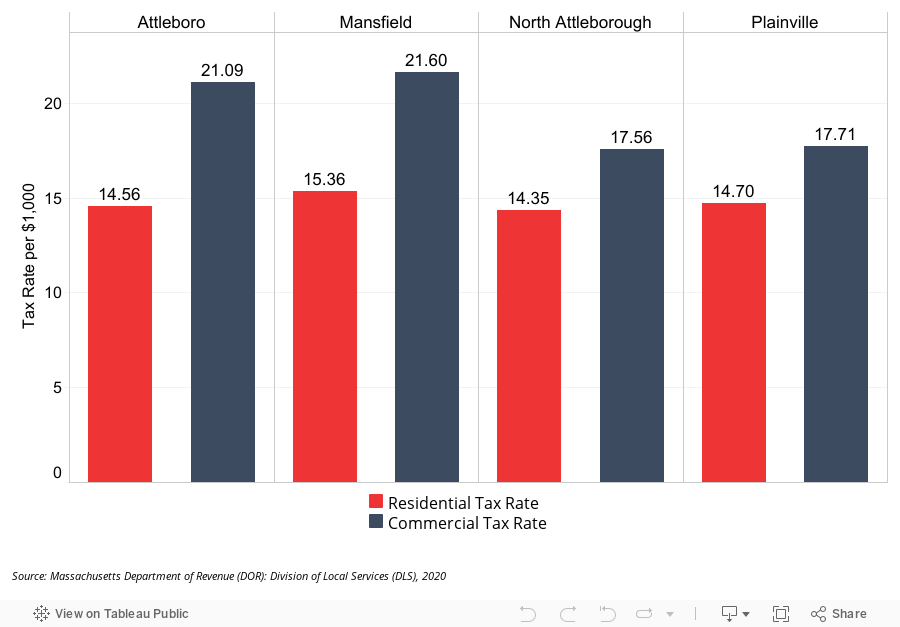
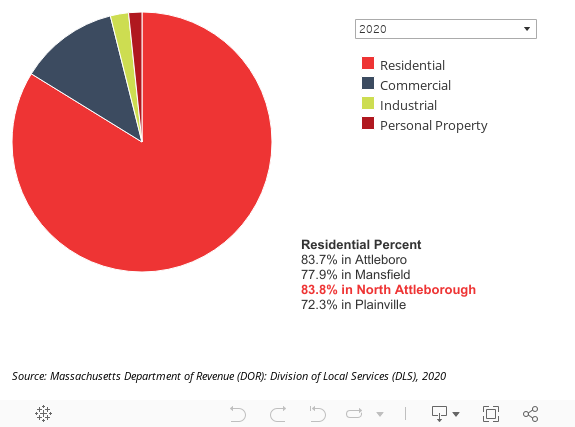
Taxes
Tax Rate
North Attleborough has a lower residential and commercial tax rate than its neighboring communities.
Tax Base
North Attleborough's tax base is comparable to its neighboring communities.
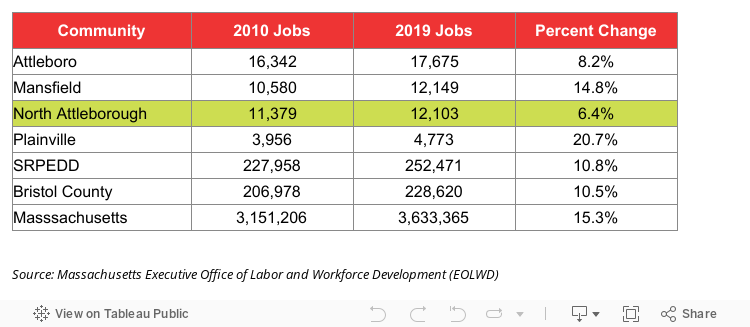
Jobs
Job Growth
North Attleborough has experienced recent job growth, but at rates lower than its neighbors, Bristol County, and the Commonwealth, as a whole. (Please note that these figures pre-date the coronavirus pandemic of early 2020).
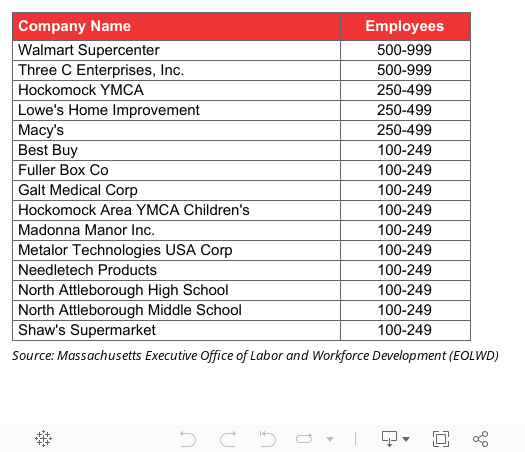
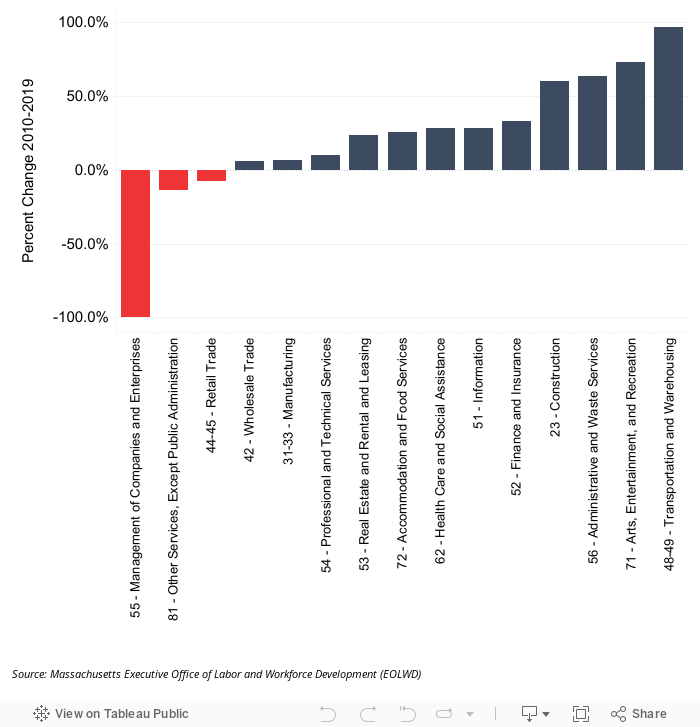
Jobs by Sector
In 2019, the largest industries in North Attleborough (total jobs) were Retail Trade, Manufacturing, and Accommodation and Food Services.
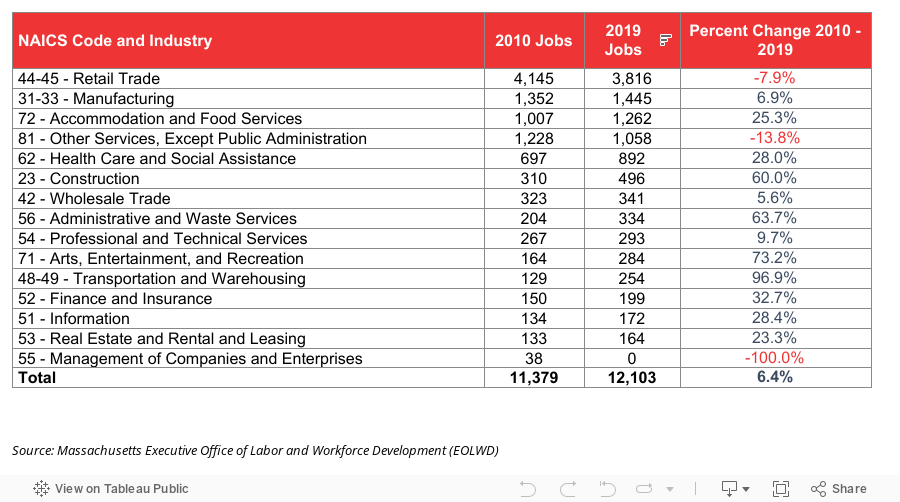
Job sectors that recorded the largest increases from 2010 to 2019 were Transportation and Warehousing, Arts Entertainment, and Recreation, and Administrative and Waste Services.
Number of Jobs by Business