Raynham Master Plan
Raynham Master Plan Data Page
This page presents information gathered and analyzed by SRPEDD in support of the ongoing Raynham Master Plan. Data helps answer many of the basic “where are we now?” and “how are we trending?” questions that can come up during a Master Plan process. As you will see, it is possible to interact with much of the data below by using your mouse to hover over, click on, or download select datasets. The Demographics Board offers an alternative view of these data as well. Data sources include the U.S. Census Bureau, the U.S. Department of Housing and Urban Development (HUD), the Massachusetts Department of Housing and Economic Development (DHCD), the Massachusetts Executive Office of Labor and Workforce Development (EOLWD), the Massachusetts Department of Revenue (DOR), Raynham Public Schools, the Town of Raynham, and SRPEDD.
Please note that this page is continually under construction as we incorporate new datasets. Please contact Lizeth Gonzalez with any questions or comments - or if you have additional data that could inform the Master Planning process!
Population
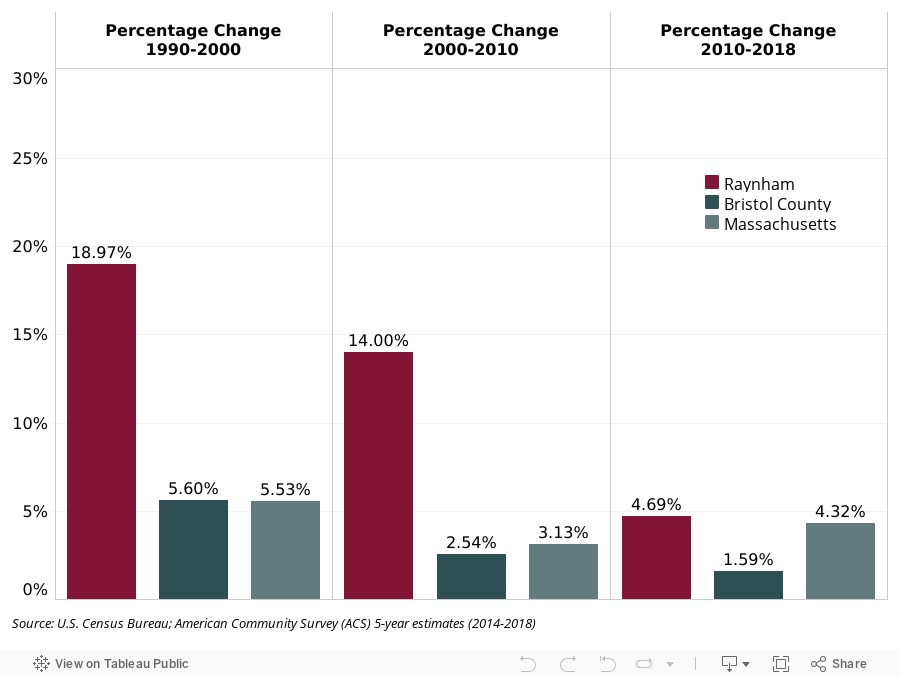
Raynham’s population was booming in the 1990s and in the 2000s. That rate has slowed in the last decade, but Raynham continues to grow at rates slightly greater than Massachusetts as a whole.
Age Trends
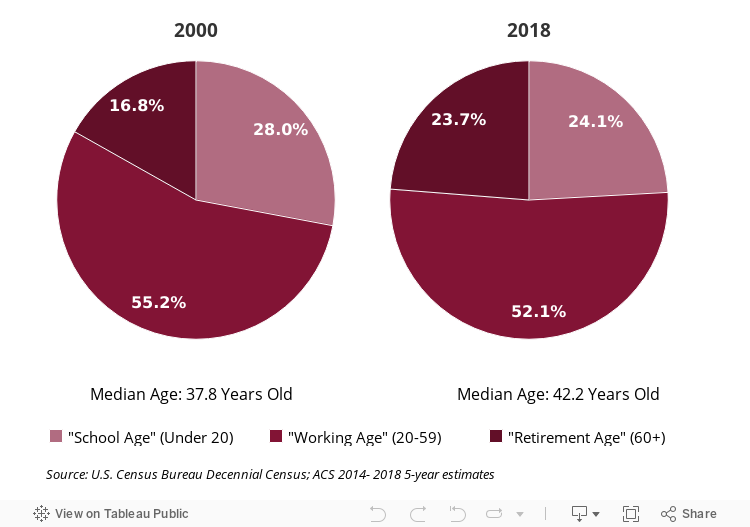
Raynham’s median age increased 4.4 years from 2000 to 2018. The “Retirement Age” population increased by 6.9%, while the “School Age” and “Working Age” populations both recorded decreases over that period.
Households
The percentage of Raynham’s households that include a person over 65 years of age increased by 14% from 2000 to 2018 - demonstrating a common trend in the Commonwealth.

Income
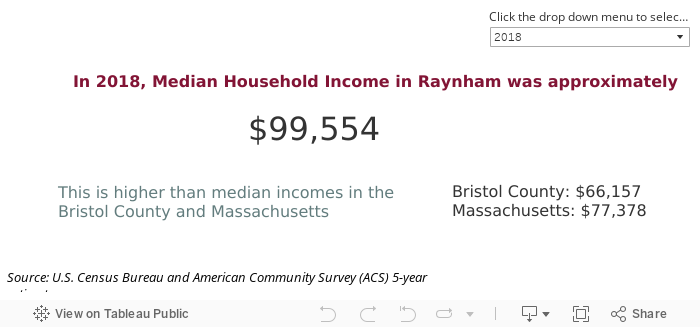
In 2018, Median Household Income in Raynham was estimated at $99,554. This is higher than the median incomes in Bristol County and Massachusetts.
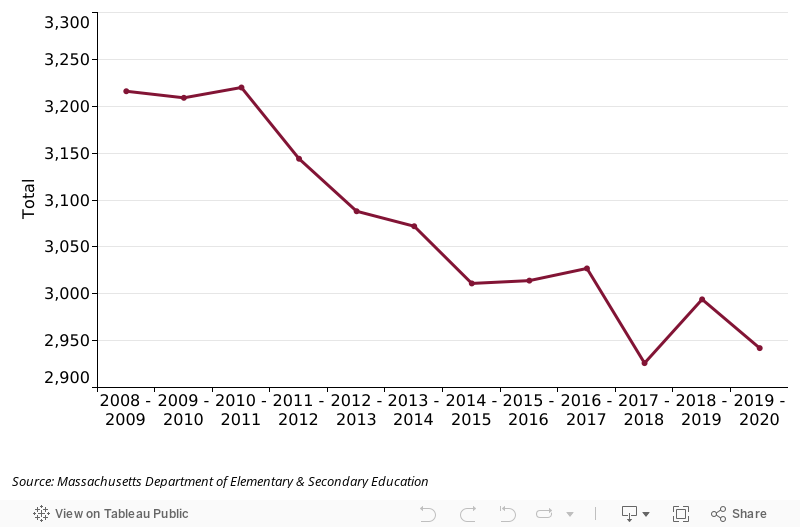
School Enrollment
Raynham’s school population has declined 8.5% in the last 12 years.
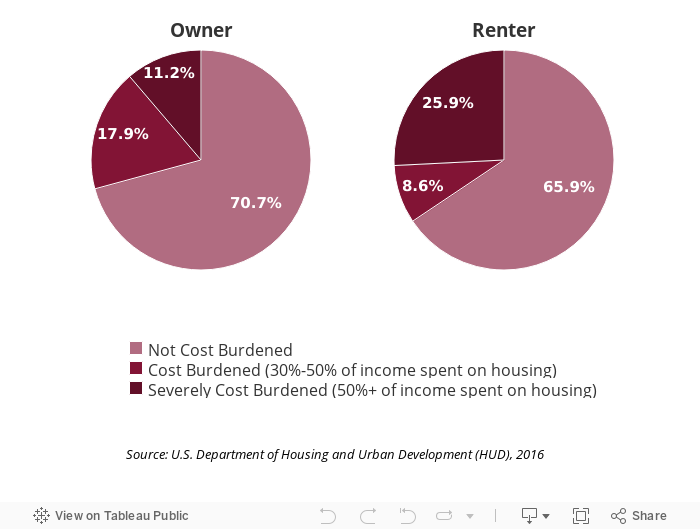
Housing
A household is considered “cost burdened” if it spends more than 30% of its income on housing costs. In Raynham, approximately 30% of homeowners and 35% of renters are considered “cost burdened”.
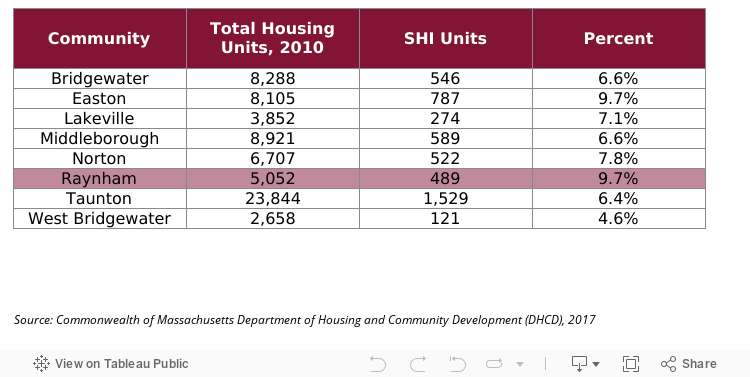
SHI
In order to gain more control over the Chapter 40B process, Raynham must have 10% of its housing stock on the State Subsidized Housing Inventory (SHI) or meet annual production goals. Raynham currently has 9.7%.
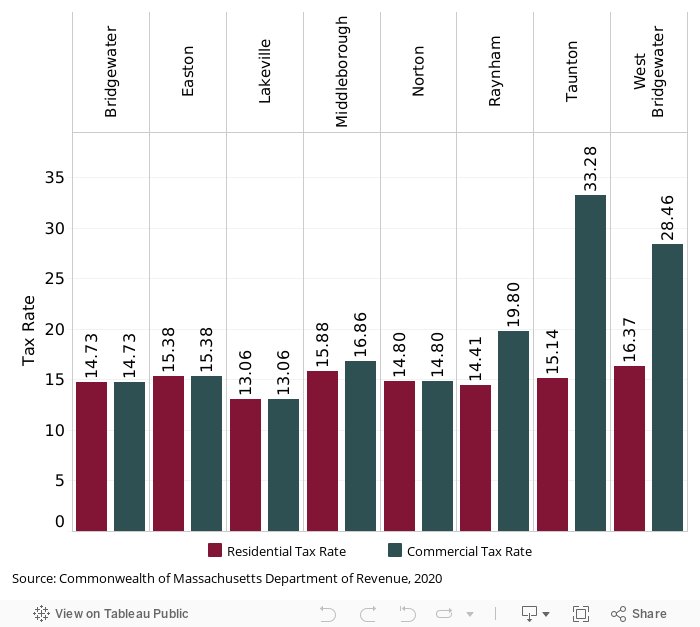
Taxes
Tax Rate
Raynham has a split tax rate (meaning that it taxes residential and commercial properties at the different rates).
Tax Base
The majority of Raynham’s tax base is from residential properties; however, the percentage is smaller than most of its neighbors.
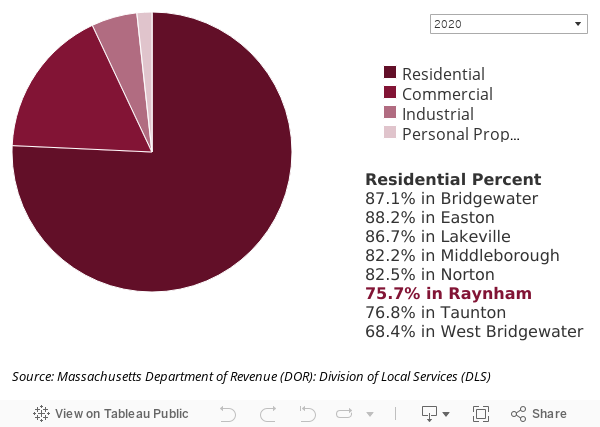
Jobs
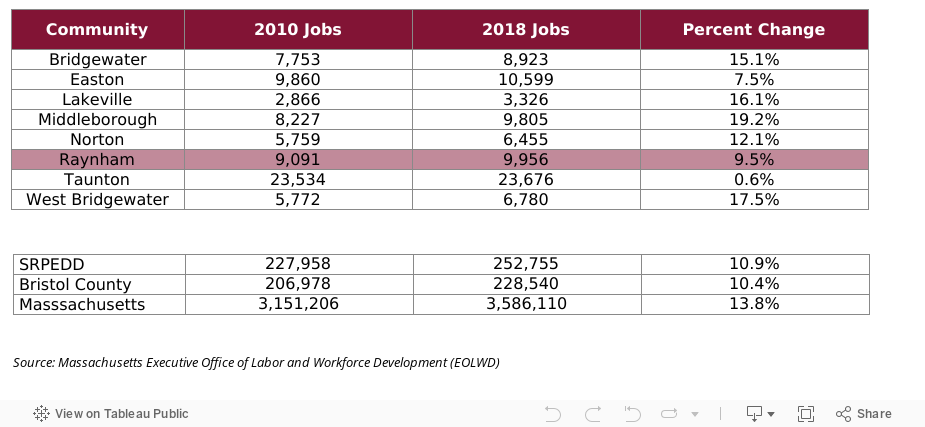
Job Growth
Raynham has experienced recent job growth, but at rates lower than many of its neighbors and the Commonwealth, as a whole.
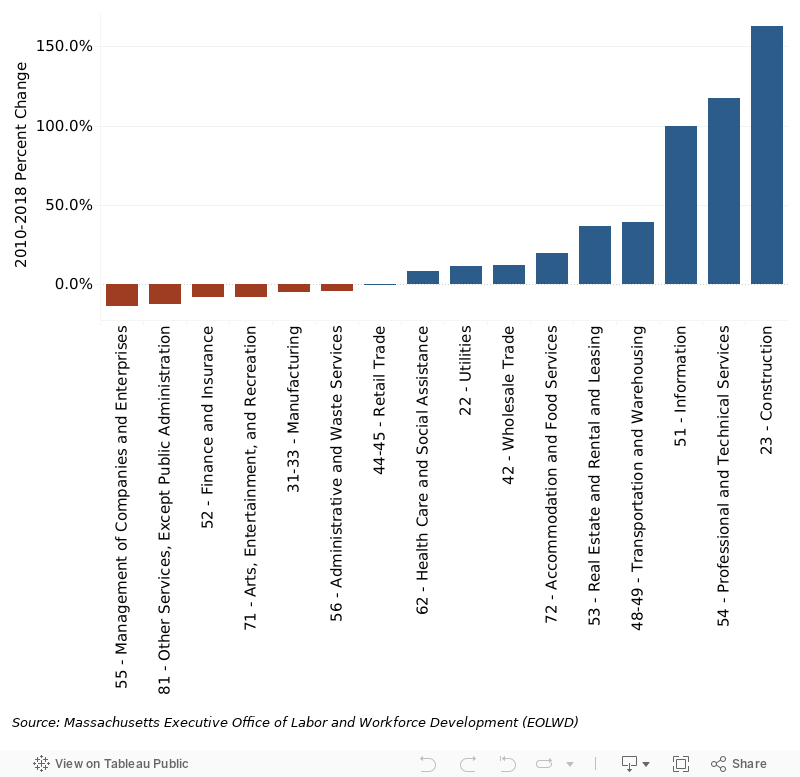
Jobs by Sector
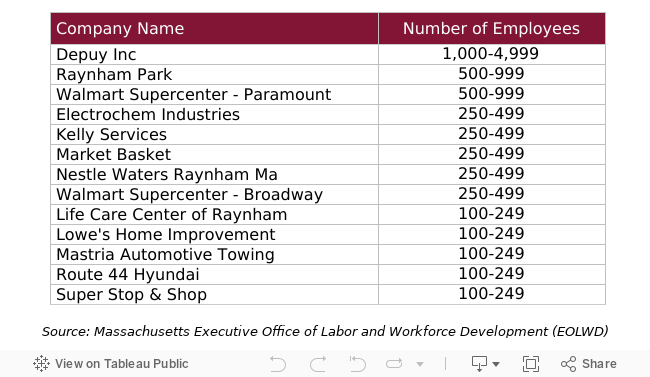
In 2018, the largest industries in Raynham (total jobs) were Retail Trade, Manufacturing, and Accommodation and Food Service.
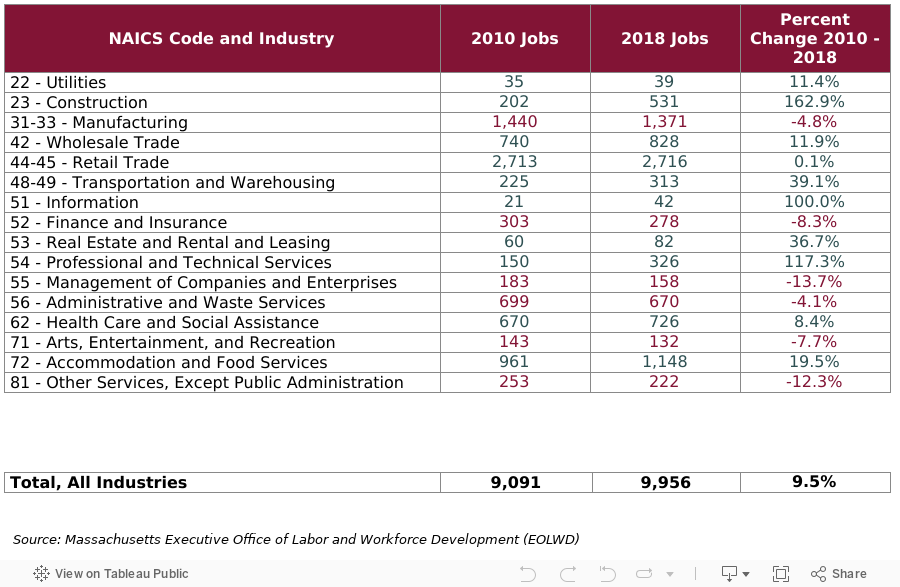
Job sectors that recorded the largest increases from 2010 to 2018 were Construction, Professional and Technical Services, and Information.
Number of Jobs by Business