Norton Master Plan
Norton Master Plan Data Page
This page presents information gathered and analyzed by SRPEDD in support of the ongoing Norton Master Plan. Data helps answer many of the basic “where are we now?” and “how are we trending?” questions that can come up during a Master Plan process. As you will see, it is possible to interact with much of the data below by using your mouse to hover over, click on, or download select datasets. Data sources include the U.S. Census Bureau, the U.S. Department of Housing and Urban Development (HUD), the Massachusetts Department of Housing and Economic Development (DHCD), the Massachusetts Executive Office of Labor and Workforce Development (EOLWD), the Massachusetts Department of Revenue (DOR), Norton Public Schools, the Town of Norton, and SRPEDD.
Please note that this page is continually under construction as we incorporate new datasets. Please contact Grant King, AICP, with any questions or comments - or if you have additional data that could inform the Master Planning process!
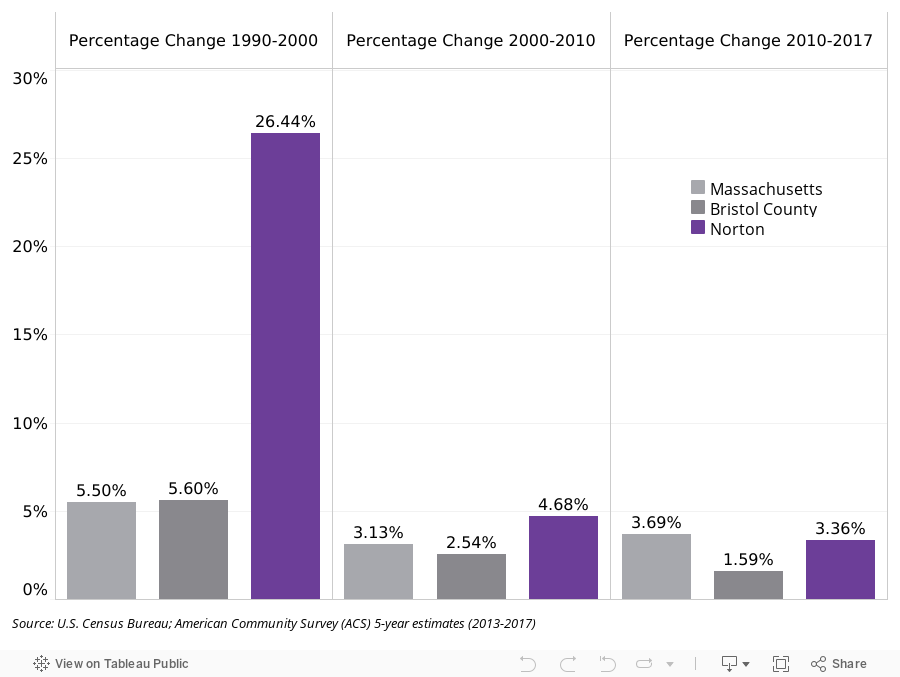
Population
Norton's population was booming in the 1990s. That rate has slowed in the last 2 decades, but Norton continues to grow at rates comparable to Massachusetts as a whole.
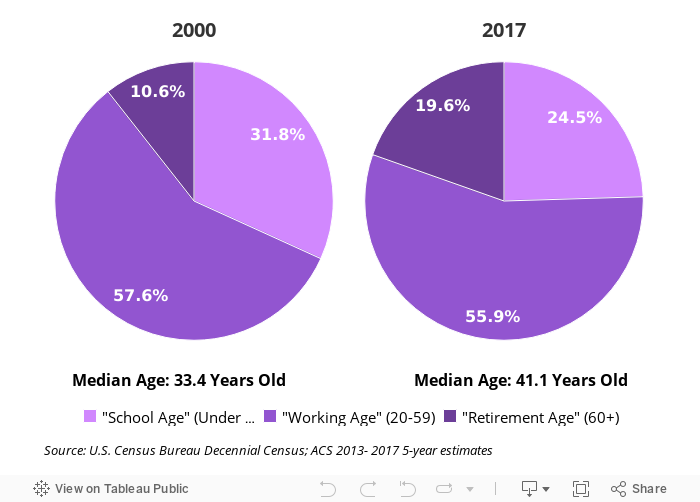
Age Trends
Norton's median age increased 7.7 years from 2000 to 2017. The "school age" population decreased 16.7%, while the retirement age population increased by almost 100%.
Households
Household sizes are declining. The town has an increasing share of older households.

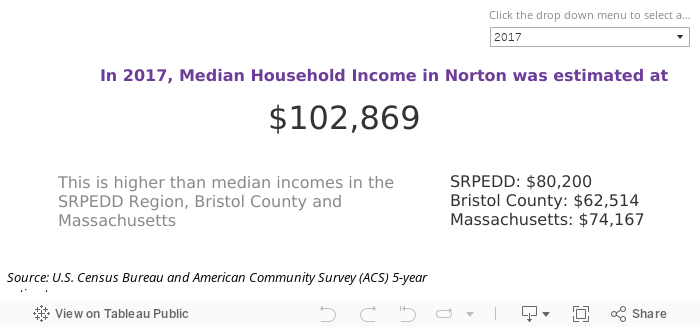
Income
In 2017, Median Household Income in Norton was estimated at $102,869. This is higher than the median incomes in Bristol County and Massachusetts.
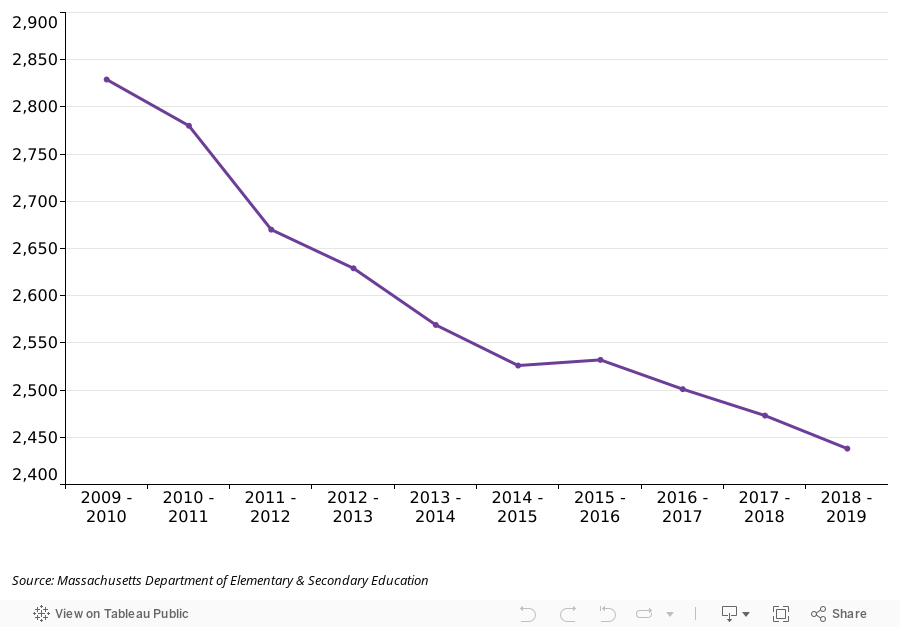
School Enrollment
Norton's school population has declined 13.8% in the last 10 years.
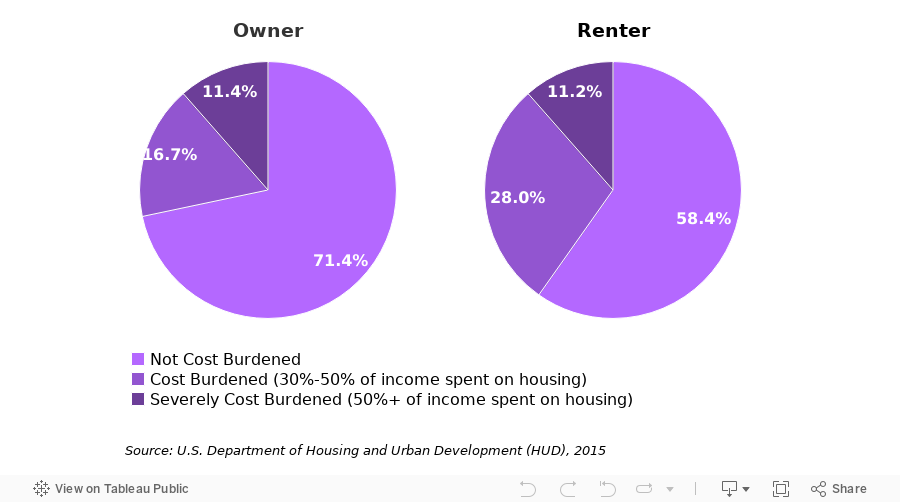
Housing
"Housing Cost Burden" means that a household spends more than 30% of its income on housing costs. According to HUD's CHAS data, some of Norton's households are burdened by housing costs.
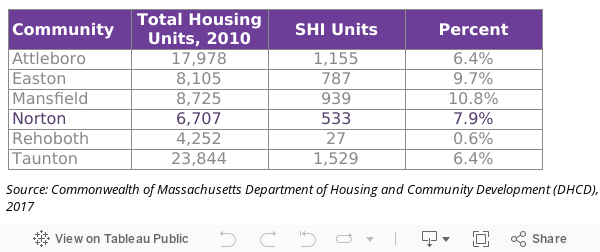
SHI
In order to gain conrtol over the Chapter 40B process, Norton must have 10% of its housing stock on the state SHI or meet annual production goals. Norton currently has 7.9%.
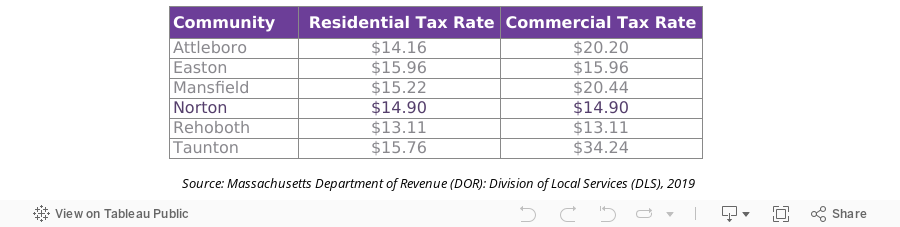
Taxes
Tax Rate
Norton has a flat tax rate (meaning that it taxes residential and commercial properties at the same rate).
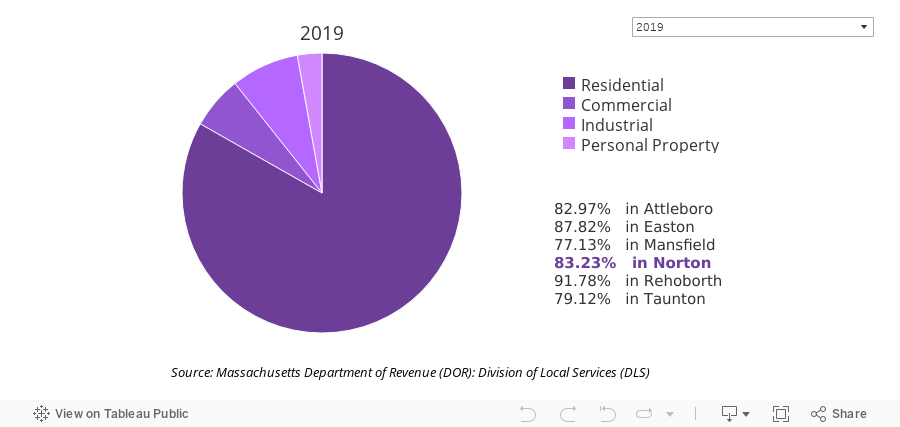
Tax Base
Norton's tax base is comparable to its neighbors - despite its flat tax rate!
Jobs
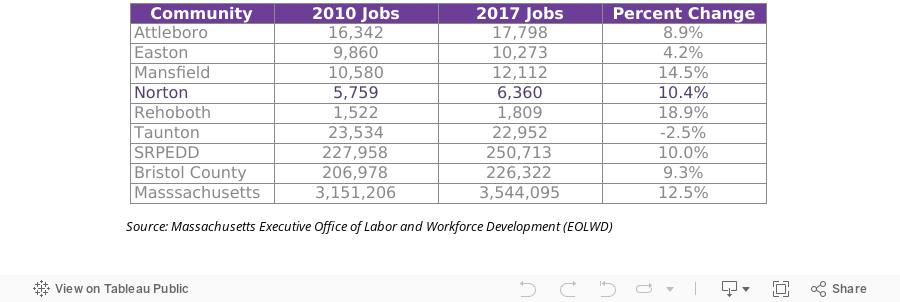
Job Growth
Norton has experienced recent job growth, but at rates lower than many of its neighbors and the Commonwealth, as a whole.
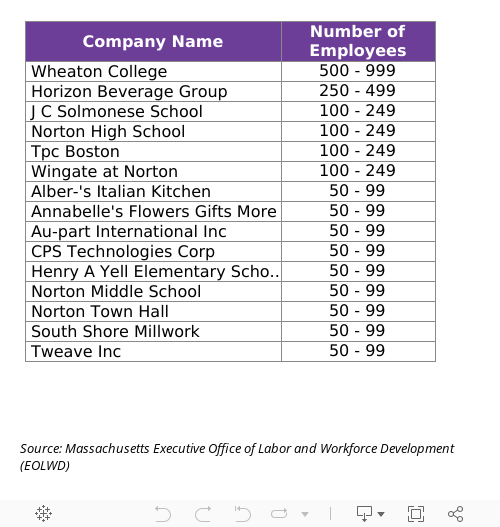
Jobs by Sector
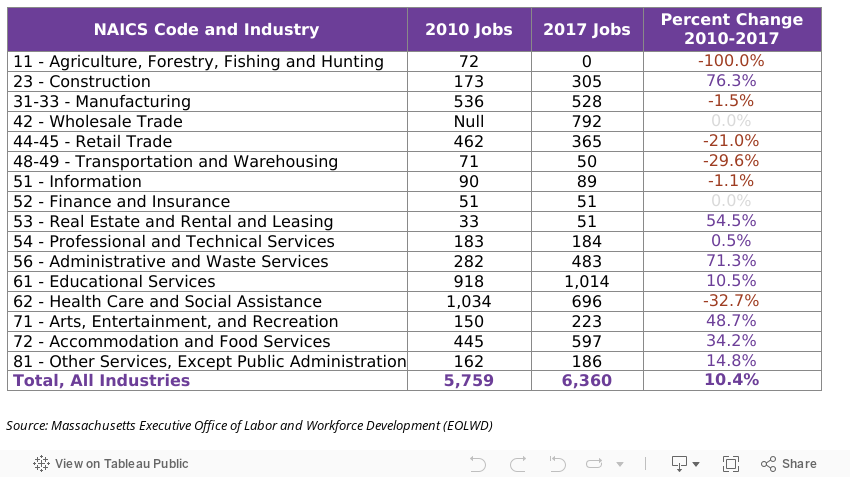
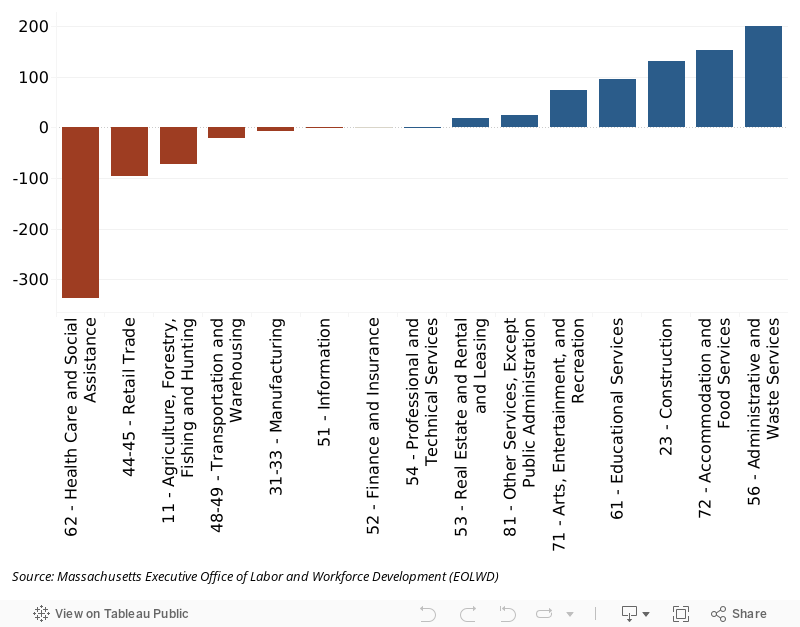
Number of Jobs by Business