Mattapoisett Master Plan
Mattapoisett Master Plan Data Page
This page presents information gathered and analyzed by SRPEDD in support of the ongoing Mattapoisett Master Plan. We will be updating this page with new information as we move through the phases of this 24-month project (anticipated end date is June 2022).
Data helps answer many of the basic “where are we now?” and “how are we trending?” questions that can come up during a Master Plan process. As you will see, it is possible to interact with much of the data below by using your mouse to hover over, click on, or download select datasets. A "Data Poster (PDF)" offers an alternative view of these data as well. Data sources include the U.S. Census Bureau, the U.S. Department of Housing and Urban Development (HUD), the Massachusetts Department of Housing and Economic Development (DHCD), the Massachusetts Executive Office of Labor and Workforce Development (EOLWD), the Massachusetts Department of Revenue (DOR), Mattapoisett Public Schools, the Town of Mattapoisett, and SRPEDD.
Please note that this page is continually under construction as we incorporate new datasets. Please contact Grant King, AICP, or Taylor Perez with any questions or comments - or if you have additional data that could inform the Master Planning process!
Population
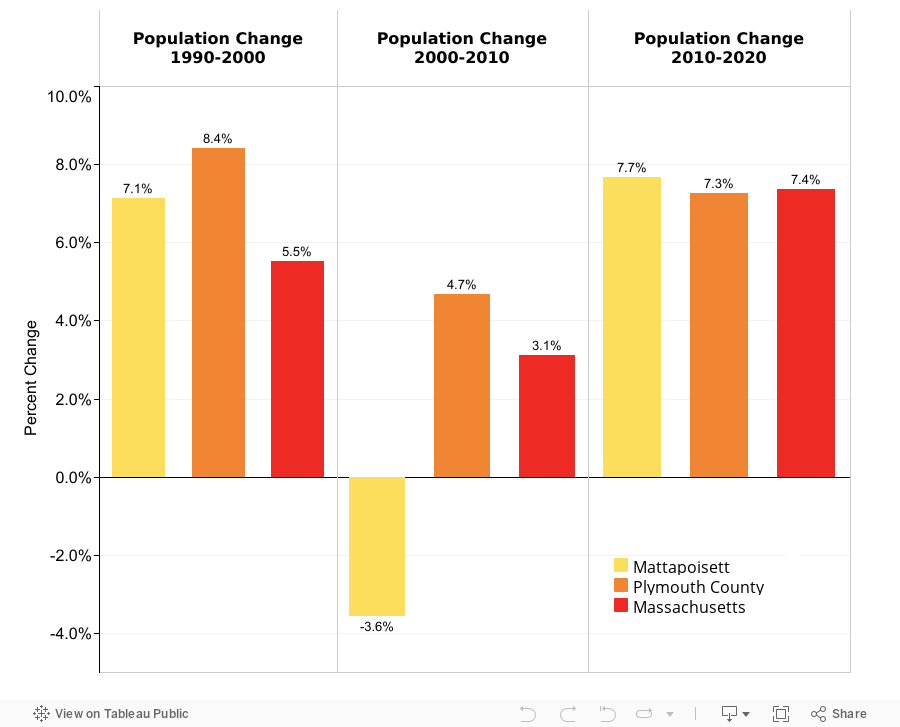
After a period of population loss in the 2000s, Mattapoisett's growth rate is once again in line with the Commonwealth and Plymouth County. However, according to UMass-Donahue Institute population projections, the next several decades may see population loss resume in town.
Age Trends
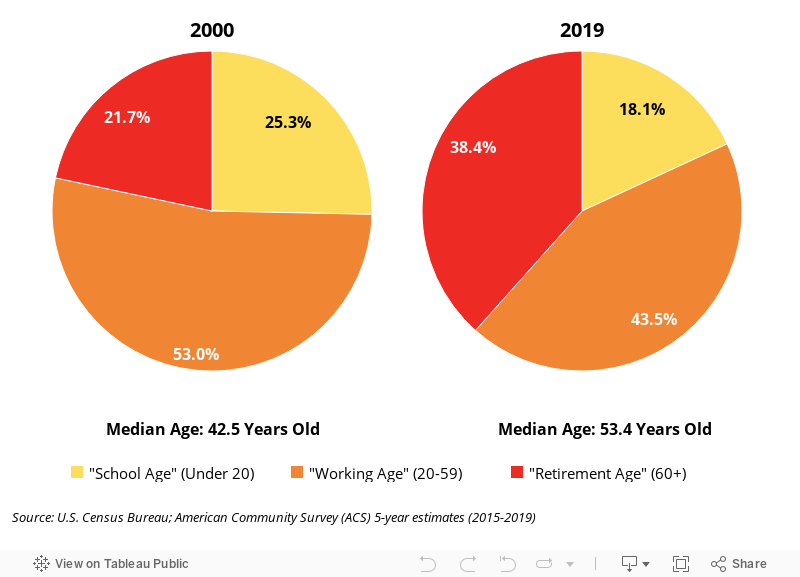
Mattapoisett's median age increased 10.3 years from 2000 to 2018. The "School Age" population decreased while the "Retirement Age" population increased.
Households
Household sizes are stable or increasing after a brief decline. The town has an increasing share of older households and single-person households.

Income
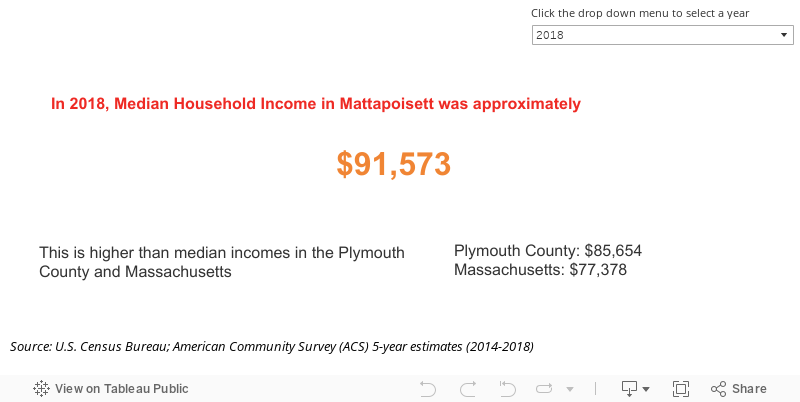
In 2018, Median Household Income in Mattapoisett was estimated at $91,573. This is higher than the median incomes in Plymouth County and Massachusetts.
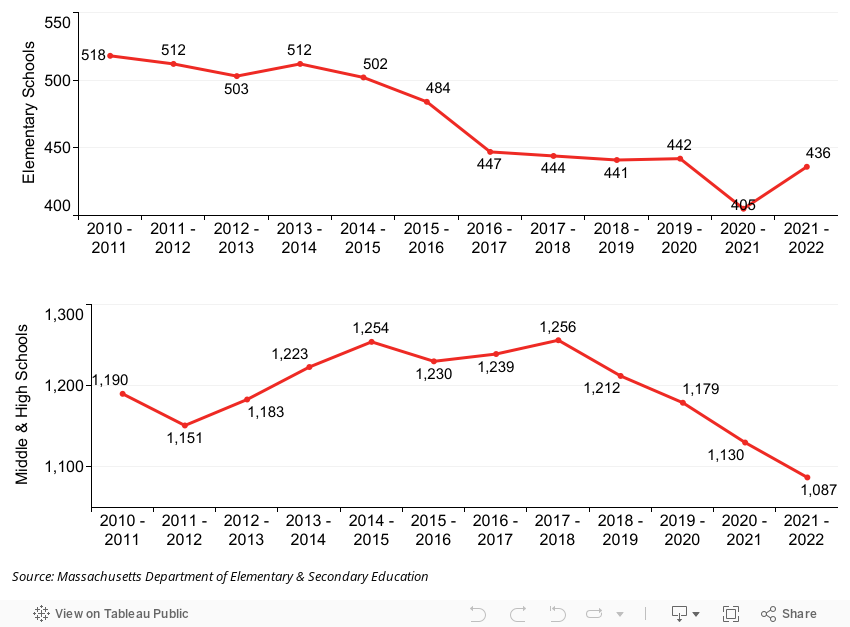
School Enrollment
Mattapoisett elementary school enrollment has dropped 14.7% over the last 10 years.
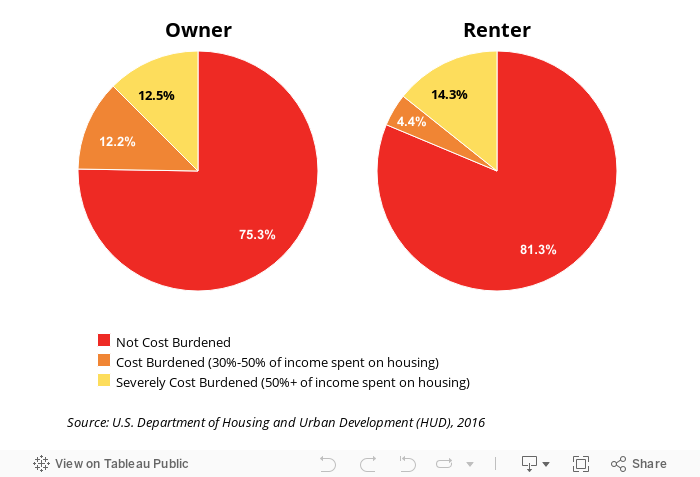
Housing
"Housing Cost Burden" means that a household spends more than 30% of its income on housing costs. According to HUD's CHAS data, some of Mattapoisett's households are burdened by housing costs.
SHI
In order to gain control over the Chapter 40B process, Mattapoisett must have 10% of its housing stock on the state Subsidized Housing Inventory (SHI) or meet annual production goals; it currently has only 2.6%.

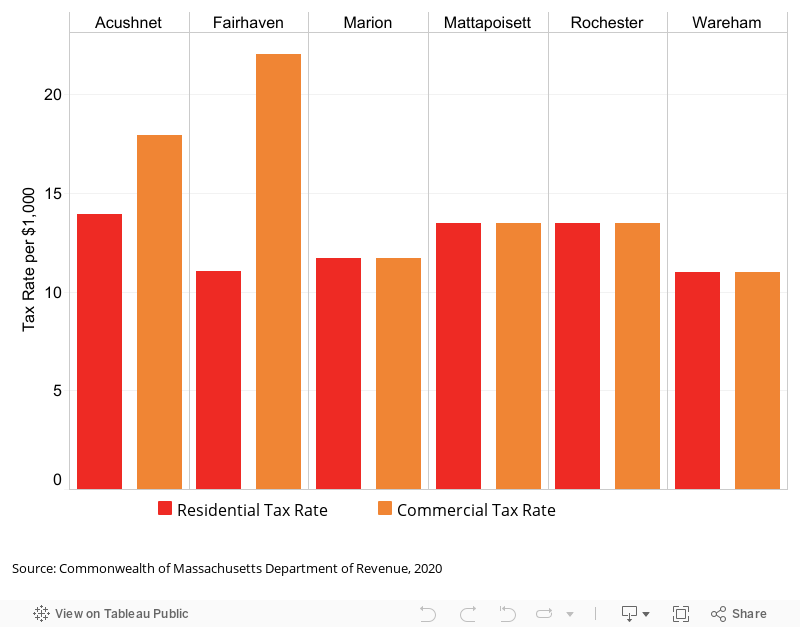
Taxes
Tax Rate
Mattapoisett has a "flat" tax rate (same for residential and commercial real estate) that is roughly in line with that of its neighbors.
Tax Base
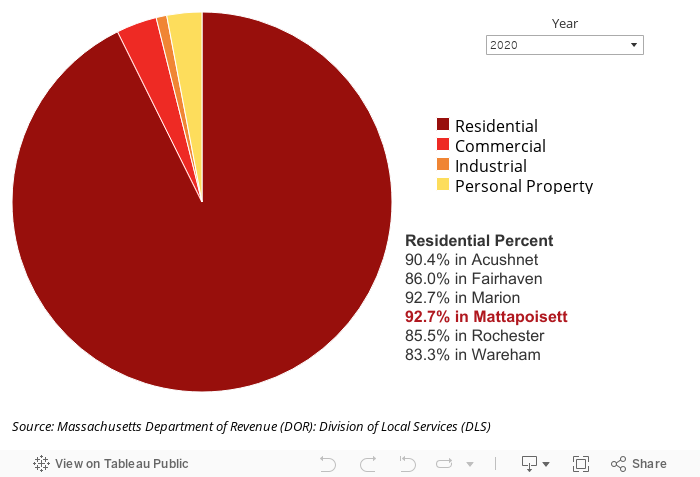
Jobs
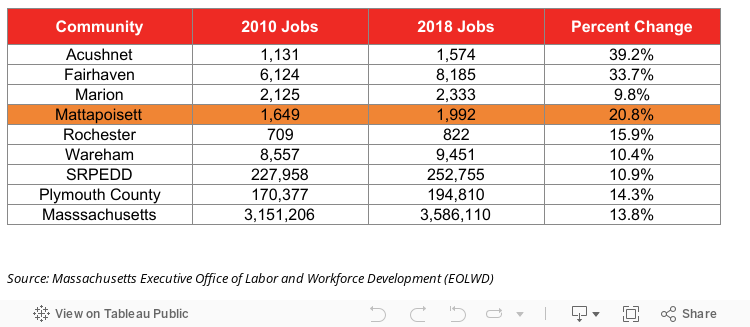
Job Growth
In recent years, Mattapoisett has experienced higher rates of job growth than many of its neighbors, Plymouth County, and the Commonwealth, as a whole. (Please note that these figures pre-date the coronavirus pandemic of early 2020).
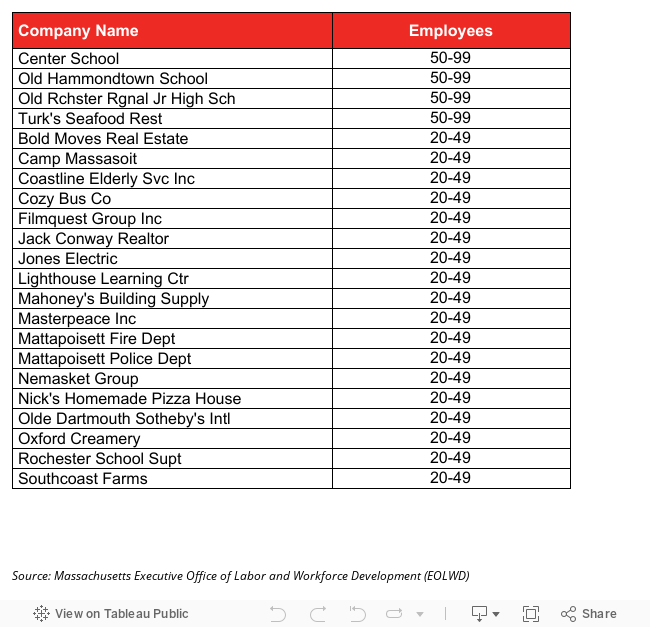
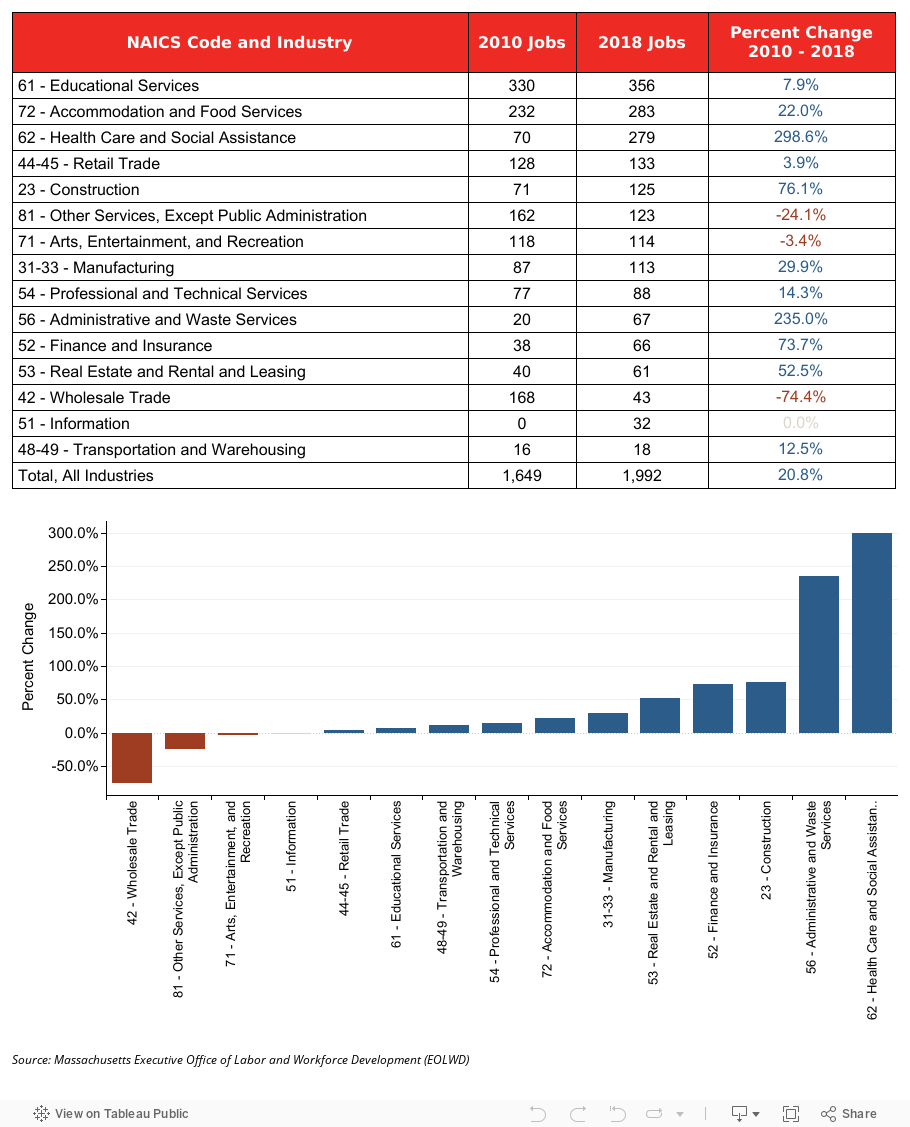
Jobs by Sector
Top Employers By Number of Employees