Dartmouth Master Plan
Dartmouth Master Plan Data Page
This page presents information gathered and analyzed by SRPEDD in support of the ongoing Dartmouth Master Plan. Data helps answer many of the basic “where are we now” and “how are we trending” questions that can come up during a Master Plan process. As you will see, it is possible to interact with much of the data below by using your mouse to hover over, click on, or download select datasets. Data sources include the U.S. Census Bureau, the U.S. Department of Housing and Urban Development (HUD), the Massachusetts Department of Housing and Economic Development (DHCD), the Massachusetts Executive Office of Labor and Workforce Development (EOLWD), the Massachusetts Department of Revenue (DOR), Dartmouth Public Schools, the Town of Dartmouth, and SRPEDD.
Please note that this page is continually under construction as we incorporate new datasets. Contact Helen Zincavage, Project Manager, with any questions or comments, or if you have additional data that could inform the Master Planning process.
Population
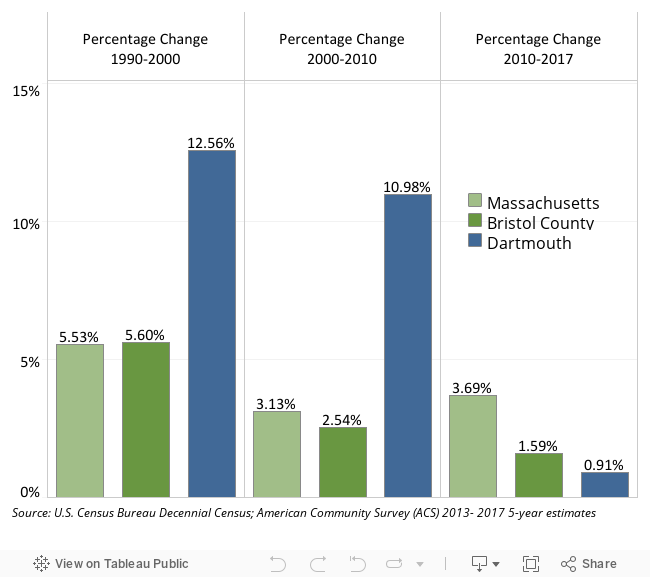
Dartmouth’s population was booming in the 1990s and 2000s. The rate has slowed to less than 1% but Massachusetts and Bristol County are growing at a faster rate than Dartmouth.
Age Trends
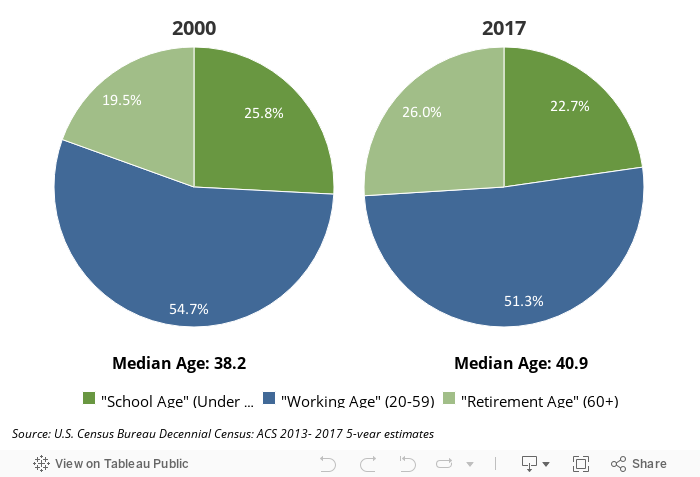
Dartmouth’s median age increased by 2 years from 2000 - 2017. The share of young, “School Age” people is declining.
Households

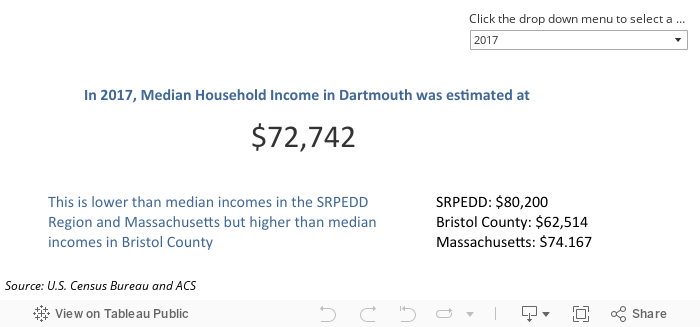
Income
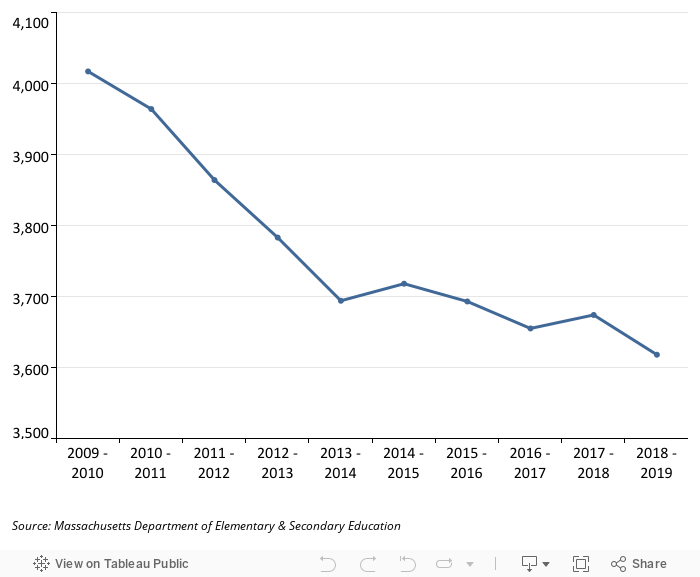
School Enrollment
Dartmouth’s student population declined 10% between 2009 and 2018.
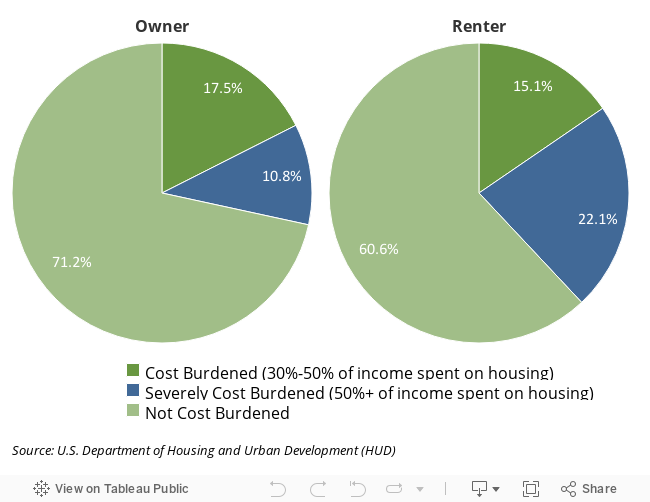
Housing
"Housing Cost Burden" means that a household spends more than 30% of its income on housing costs. A quarter of owner households are housing cost burdened. A little more than one-third of renters are burdened, with many spending more than 50% of their income on housing.
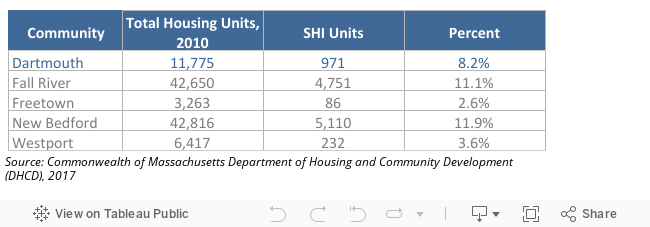
SHI
In order to gain more control over the Chapter 40B process, Dartmouth must have 10% of its housing stock on the state SHI or meet annual production goals.It currently has 8.2%.
Taxes
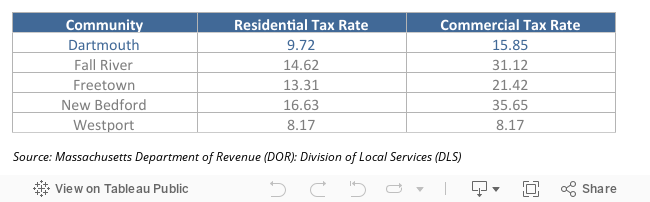
Tax Rate
Dartmouth has a split tax rate (meaning that it taxes for residential and commercial properties are different). Compared to its neighbors, the town’s tax rates are lower than Fall River, New Bedford, and Freetown but higher than Westport.
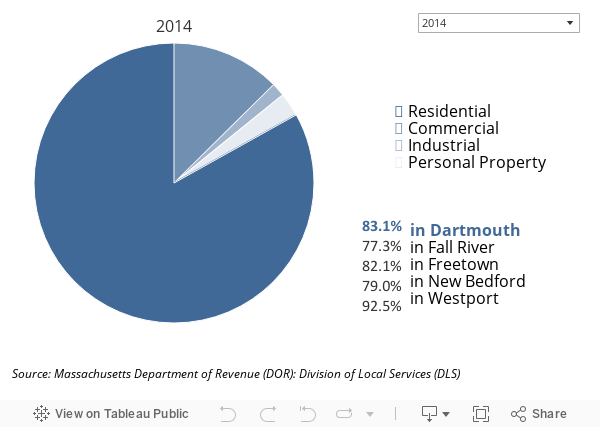
Tax Base
Dartmouth’s tax base is 83% residential.For FY2018, the average single family tax bill in Dartmouth was $3,843 compared to $3,552 in New Bedford, $3,304 in Westport, and$3,173 in Fall River.
Jobs
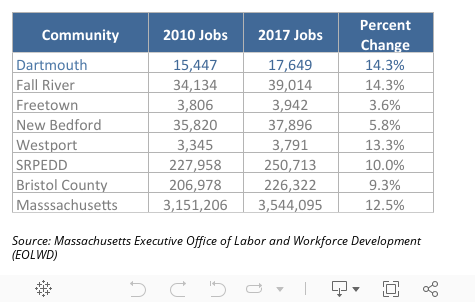
Job Growth
In the past seven years, Dartmouth has gained about 2,202 jobs. Job growth was higher than most of its neighbors, the state, and the region.
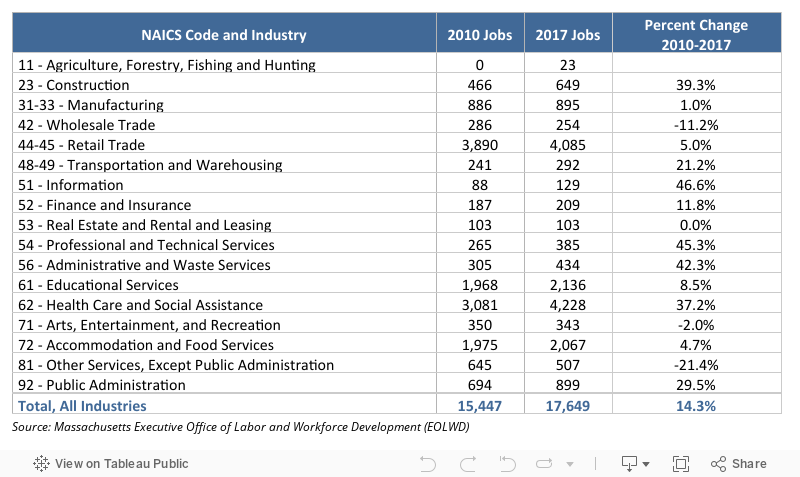
Jobs by Sector
In 2017, the biggest industries in Dartmouth (in total jobs) were information, professional and technical services, and administrative and waste services.
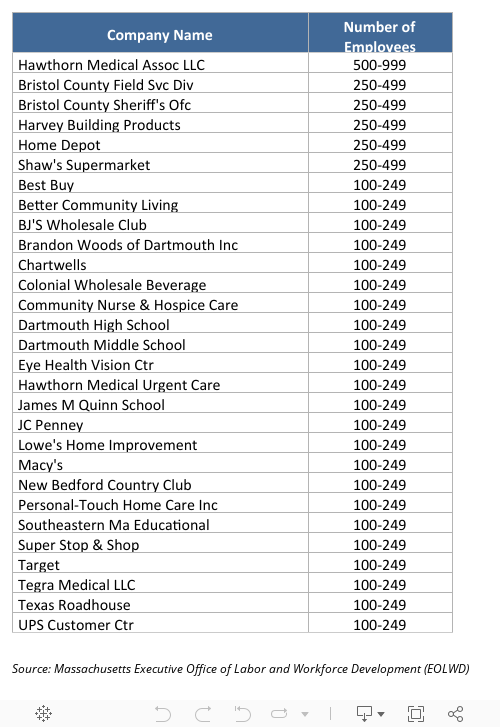
Number of Jobs by Business