Berkley Master Plan
Berkley Master Plan Data Page
This web page presents information gathered and analyzed by SRPEDD in support of the ongoing Berkley Master Plan. Final versions of this information, input from business owners, town officials, and the public, and past planning efforts will inform the final document.
You may use your mouse to hover over, click on, download, and otherwise interact with much of this data. Please contact Eric Arbeene, AICP with any questions, proposed edits, or comments. Data sources include the U.S. Census Bureau, the U.S. Department of Housing and Urban Development (HUD), the Massachusetts Department of Housing and Economic Development (DHCD), the Massachusetts Executive Office of Labor and Workforce Development (EOLWD), the Massachusetts Department of Revenue (DOR), Berkley Public Schools, the Somerset Berkley Regional School District, Bristol County Agricultural High School, Bristol-Plymouth Regional Technical School, the Town of Berkley, and SRPEDD.
Population
Berkley is growing. Its population has increased faster than that of Bristol County and Massachusetts from 1990 to 2016.
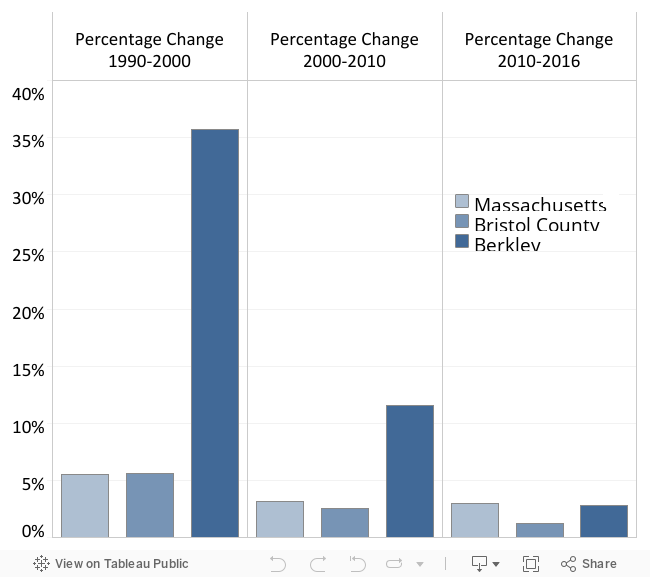
Source: U.S. Census Bureau, 1990, 2000, 2010; U.S. Census Bureau American Community Survey (ACS) 2012-2016
Age Trends
Berkley's median age increased by 7 years from 2000 to 2016. The older “Retirement Age” population is increasing while the younger, "School Age" population is decreasing.
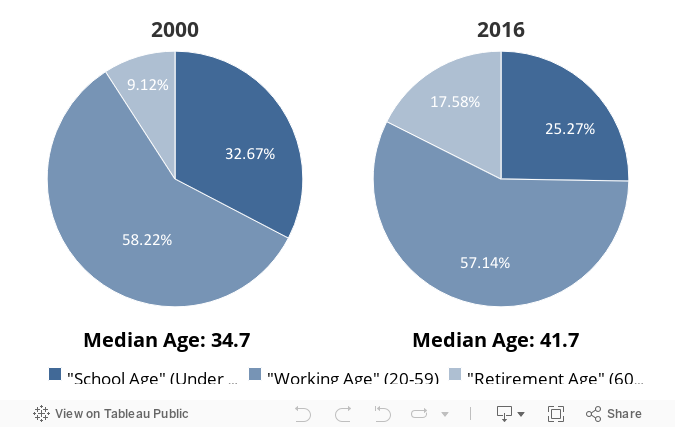
Source: U.S. Census Bureau: 2000; U.S. Census Bureau American Community Survey (ACS) 2012-2016
Households
In 2016, Berkley's average household size was 2.83 persons; a 9.0% decrease from 3.11 persons in 2000.

Income
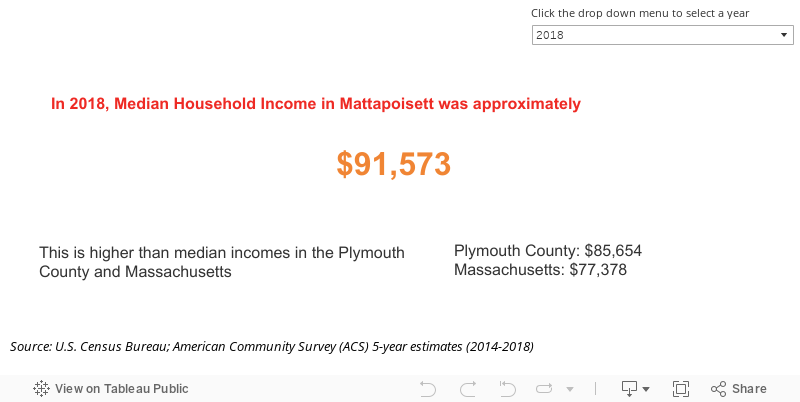
Relative to Bristol County, Plymouth County and to the Commonwealth, Berkley is an affluent community.

School Enrollment
Berkley's student population declined 3% between 2008 and 2017.
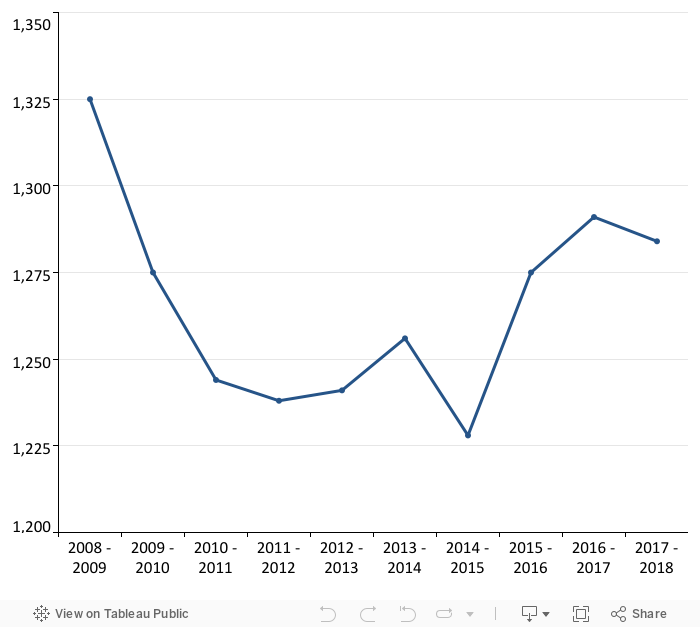
Source: Berkley Public Schools, Somerset Berkley Regional School District, Bristol County Agricultural High School, and Bristol-Plymouth Regional Technical School
Housing
Households that spend more than 30% are considered to be "Housing Cost Burdened." In Berkley, homeowners are more likely to be cost burdened than renters.
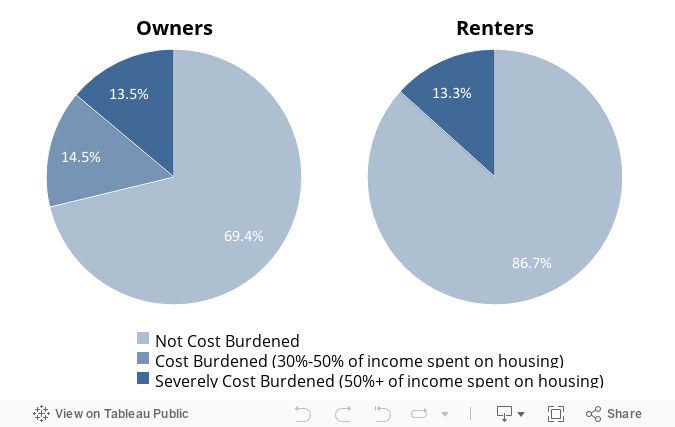
Source: U.S. Department of Housing and Urban Development (HUD)
SHI
In order to gain more control over the Chapter 40B process, Berkley must have 10% of its housing stock on the state SHI or meet annual production goals. It currently has 1.1%
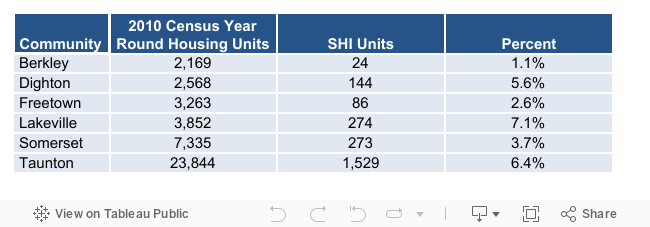
Source: Commonwealth of Massachusetts Department of Housing and Community Development (DHCD), 2017
Taxes
Tax Rate
Berkley’s Residential and Commercial millage rates are lower when compared to nearby communities.

Source: Massachusetts Department of Revenue (DOR): Division of Local Services (DLS)
Tax Base
Due to the lack of a commercial and industrial tax base, Berkley’s residents shoulder a higher percentage of the tax base compared to nearby communities.
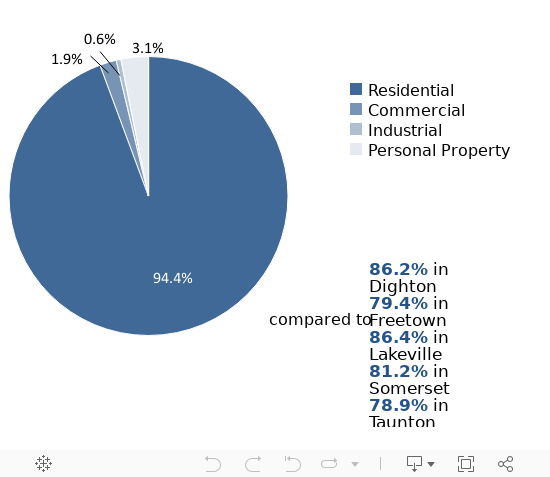
Source: Massachusetts Department of Revenue (DOR): Division of Local Services (DLS)
Jobs
Job Growth
In the past ten years, Berkley gained approximately 122 jobs. Job growth in Berkley was higher than all of its neighbors, the state, and the region.

Source: Massachusetts Executive Office of Labor and Workforce Development (EOLWD)
Jobs by Sector
In 2017, the biggest industries in Berkley (in total jobs) were construction and accommodations and food services.
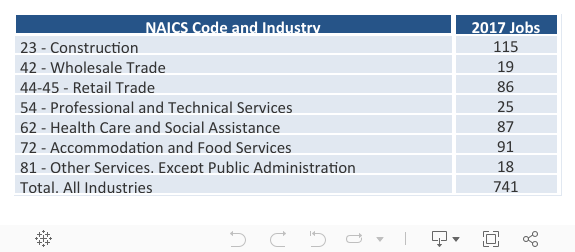
Source: Massachusetts Executive Office of Labor and Workforce Development (EOLWD)
Number of Jobs by Business
The top employers in Berkley are the Somerset Berkley Regional School District and the Town of Berkley.
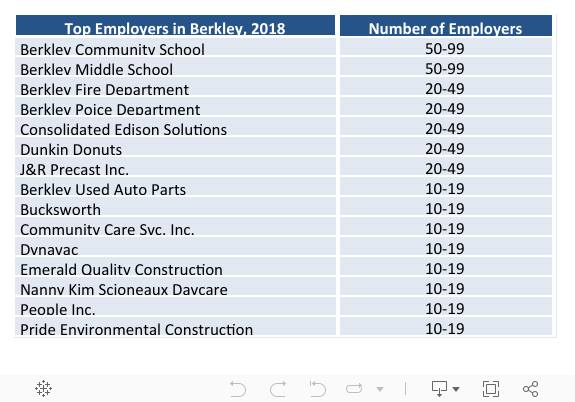
Source: Massachusetts Executive Office of Labor and Workforce Development (EOLWD)